But It’s a Dry Heat… like a Furnace
by Dirk Baker | Updated: 06/21/2021 | Comments: 6
In this article, I'll share my experience collaborating on a research project to record some extreme weather conditions that may even set a world record!
On August 16, 2020, the weather station located at Furnace Creek in Death Valley National Park (California, USA) recorded a temperature of 54.4 °C (130 °F). If confirmed, this would be a record high for an automated measurement in the western hemisphere, perhaps even the world. News of this, of course, got a lot of attention from both enthusiasts and skeptics. The National Weather Service (NWS) is conducting a rigorous test of the instrumentation involved, which will determine whether a new record has, indeed, been set.
|
Recommended for You: These articles provide additional information: |
Shortly after that temperature was recorded, I got in touch with the personnel in the Las Vegas office of the NWS who oversee and maintain the Furnace Creek weather station to see how I—and Campbell Scientific—could be of assistance. Understandably, they ultimately chose to test the sensor in an independent lab rather than send it to us (the manufacturer). However, I also offered to collaborate with them and the National Park Service (NPS) on a short-term research project that would co-locate a high-accuracy temperature measurement next to their existing station for a few months.
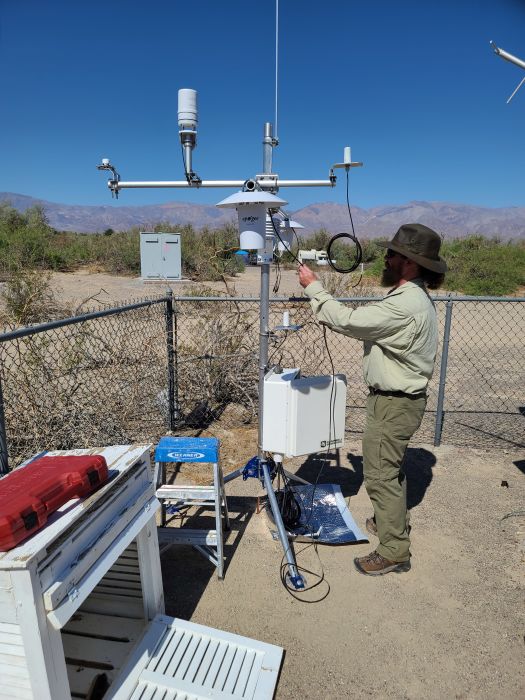
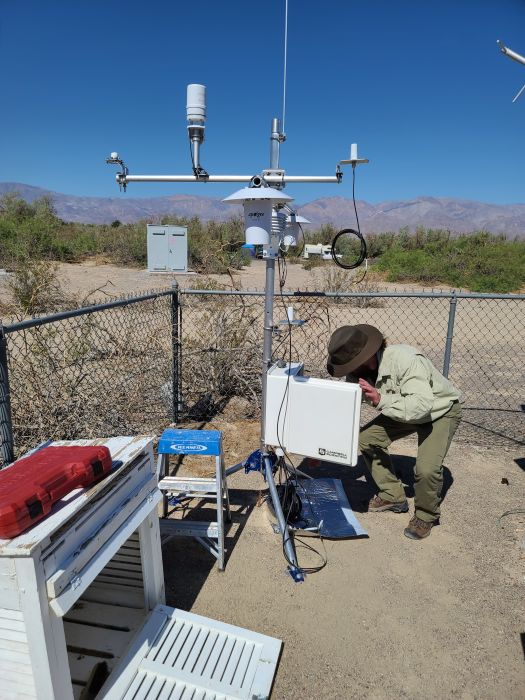
And so, I found myself in Death Valley in early May 2021 installing a station at air temperatures that were already in excess of 38 °C (100 °F).
Some Details...
The August 16, 2020 temperature was recorded by a CR1000 Measurement and Control Datalogger with a CS215-L Digital Air Temperature and Relative Humidity Sensor that was mounted in a passive radiation shield. A passive radiation shield is simply a set of carefully designed plates that are stacked together. These plates are spaced apart and designed to prevent direct sunlight from impacting the temperature measurement while allowing air to flow through and past the sensor. Direct solar radiation on a sensor can cause a large upward bias in measurements—several degrees Celsius in some cases.
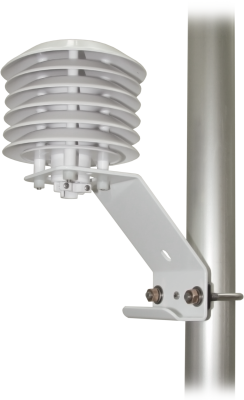
A passive radiation shield
At times of low or no wind, however, air can become trapped in a passive shield that also causes a bias—though not of the magnitude caused by solar radiation. An active, or aspirated, radiation shield addresses this issue by incorporating a fan to continuously move air past the sensor while also protecting it from solar radiation. This method is commonly considered the best for accurate air temperature measurements. Until recently, however, aspirated shields required a prohibitive amount of power to operate on remote, low-power weather stations.
An aspirated radiation shield
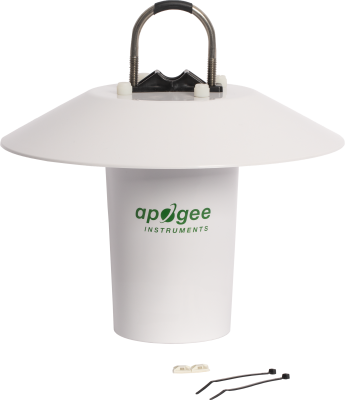
The new station I installed includes two TS100SS Aspirated Radiation Shields and two passive 41303-5A 6-Plate Solar Radiation Shields. There is a HygroVue™5 sensor (measuring temperature and relative humidity) in one of the aspirated shields and one of the passive shields. In the other aspirated shield, there are three independent thermistor beads. In the other passive shield, there is a 109 Temperature Probe. The thermistor beads are the same as those used in the 109.
Some of the key features of the TS100SS aspirated shield are that it is lower power and cost compared to others on the market. The shield incorporates an aerodynamic design to take advantage of winds when they occur. In addition, the duty cycle of the fan can be controlled to save power—for instance, reducing the fan speed at night.
Also included on this station are a ClimaVue™50 Compact Digital Weather Sensor and a CS320 Digital Thermopile Pyranometer. A CR1000X Measurement and Control Datalogger was also installed next to the CR1000 for independent data collection. Data from the CS320 are used by the CR1000X to reduce the duty cycle of both TS100SS shields at night to save power.
Prior to installation, I tested the 109 sensor and triplicate thermistor beads in our liquid bath (Fluke 7040 High Precision Bath) using a Rosemount PRT as reference. This bath controls the temperature of actively circulated antifreeze so that we can have confidence that the sensors are exposed to the same conditions. The most recent calibration certificate of the Rosemount from an independent lab shows that its uncertainty is less than 0.01 °C over the range of approximately -40 to +230 °C. At 50, 55, and 60 °C, the 109 sensor and thermistor beads all performed very well. (See the figure below.) For instance, the maximum absolute difference relative to the reference across sensors and temperature set points was 0.07 °C.
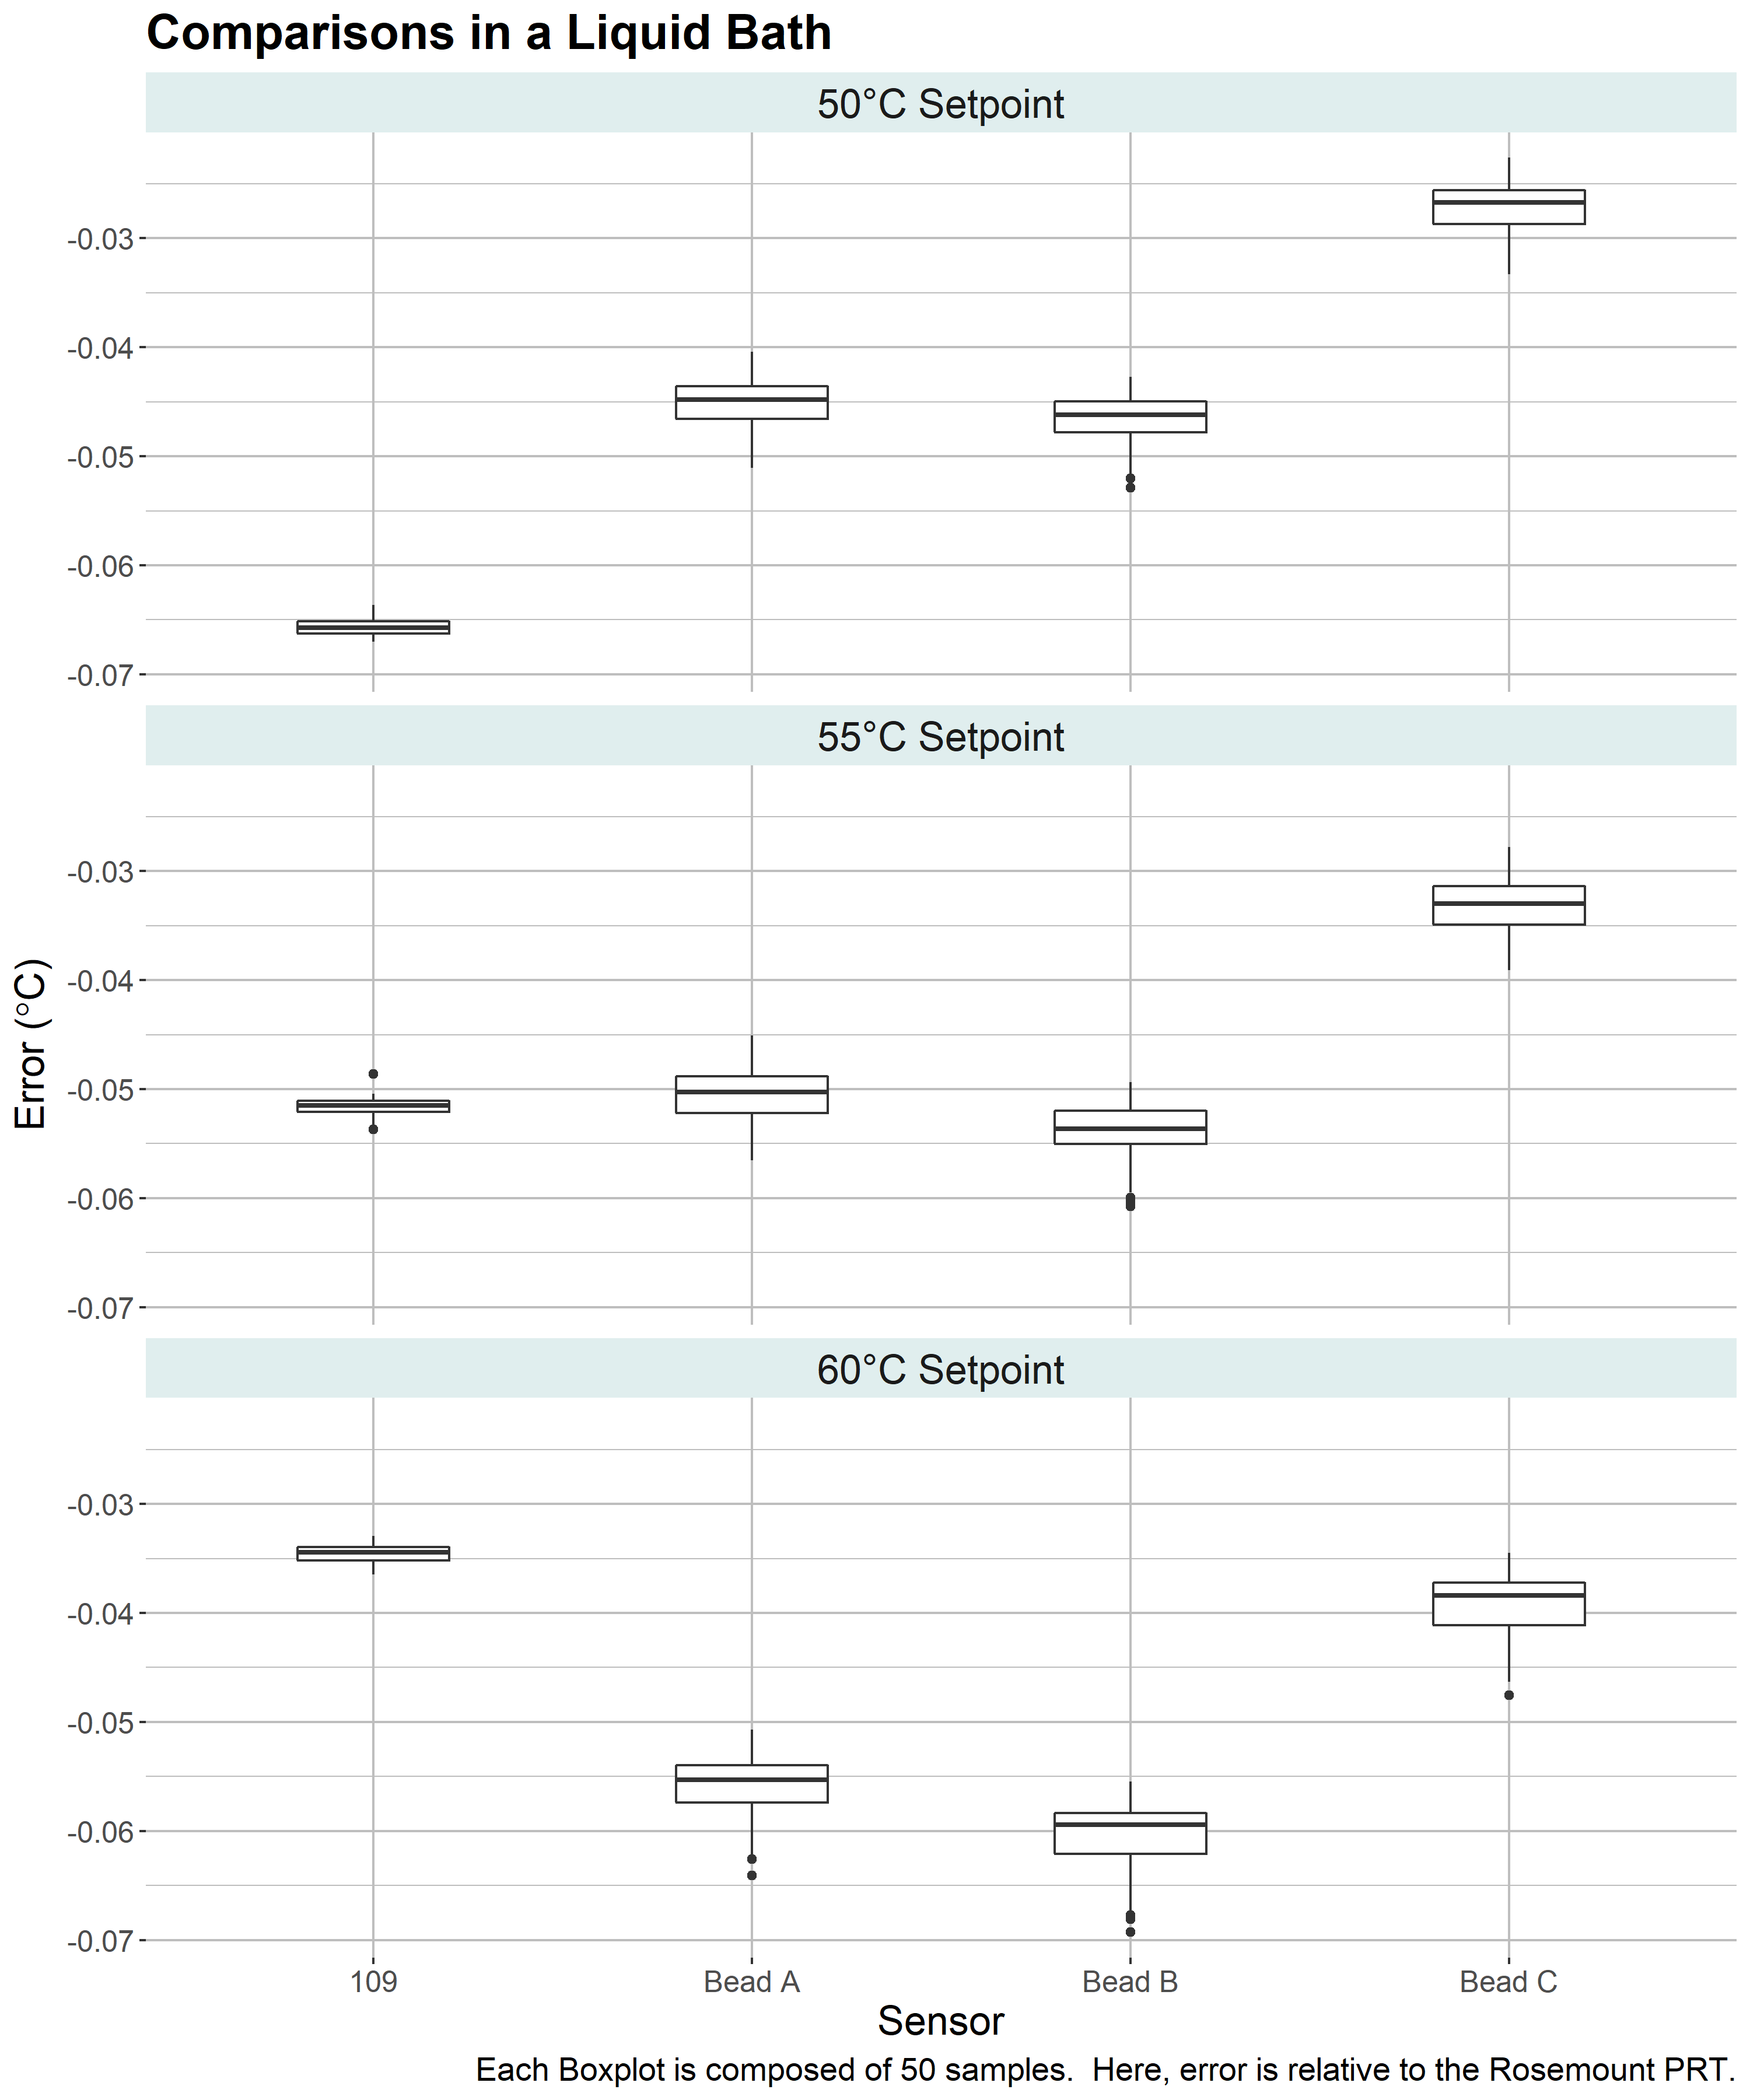
Pre-deployment temperature sensor testing against a high-accuracy reference Rosemount PRT
Click the figure for a larger image.
What's Next?
I will return to Death Valley in the fall of 2021 to take down the temporary station. In the meantime, I and my collaborators with the NWS and NPS will be watching with interest. I can’t say that I unreservedly wish for a record temperature to be set this summer due to the other implications it would have in a warming climate. However, there will be a great deal of interesting data produced regardless of what conditions actually occur.
If you have questions about this research project, please post them below.


About the Author
 Dr. Dirk V. Baker was a Senior Scientist and the Global Science Program Manager at Campbell Scientific. His areas of interest included ecology, agriculture, and meteorology—among others. He has a bachelor's degree in wildlife biology and a doctorate in weed science, both from Colorado State University. Dirk’s graduate and postdoctoral research centered around measuring and modeling wind-driven plant dispersal.
Comments
Jeff Masters | 07/09/2021 at 07:50 AM
Hello Dirk, how has your new equipment compared to the high of 126.4°F measured yesterday? If DV reaches 130 again this weekend, I'd like to get a quote from you for a follow-up article to the one I posted last year (which is linked in the story above), https://yaleclimateconnections.org/2020/08/death-valley-california-may-have-recorded-hottest-temp-in-world-history/. Please email me at weatherman.masters@gmail.com if possible. Thanks, Jeff Masters
Dirk | 07/09/2021 at 11:40 AM
Hi Jeff, thanks for reaching out and I will contact you. The short answer is that, while there is a cellular modem on the station I installed, cellular coverage is very limited and communications have been spotty. I've mostly relied on local personnel to manually download data and I don't have the most recent.
Bill Reid | 07/16/2021 at 12:20 PM
Hi Dirk,
It looks like you got the record high temperatures that you were hoping for! I was at the DV weather station on July 10 and I took a bunch of photos, including your new equipment. I will be posting my little summary soon on my web site (stormbruiser.com). It was 129.4F on that date, the day after the 130.0F.
I am curious as to how the "current" and daily max and min temperatures at the DV station are determined. Are these based on averages of a minute, or 5- minutes, or perhaps a much shorter time frame? I am referring to the official CS instrumentation that has been in place for about 7 years.
Thank you!
Bill Reid
Dirk | 07/20/2021 at 04:37 PM
Hi Bill,
Thanks for your comment and I apologize for the delay in getting back to you! I wanted to confirm with my collaborators that they were ok with me sharing that information.
The NWS station samples the sensors once per minute. The maxima and minima for the hourly reporting are based simply on the numerical maximum and minimum for a given hour and the time at which those occur. There is no additional processing.
That said, the sensor on that station is the CS215 which, according to its specifications, has a time constant of 120 seconds or less. Assuming (for the purposes of conversation) that it is exactly 120 seconds for that specific sensor; theoretically, it would take about 360 seconds for it to fully equilibrate to a step change in temperature. You probably already know this, but it is worth pointing out in a public post.
Whether that is truly equivalent to smoothing or averaging is probably debatable, but it will dampen the sensor’s response to short-duration fluctuations.
Best,
Dirk
Bill Reid | 07/13/2023 at 11:30 PM
Hello again, Dirk,
I may be visiting the DV weather station again this weekend when temperatures might flirt with 130F. I was wondering if the "test" instrumentation is still in place or not. And, I was wondering if there has been consideration to have the official DV temperature equipment one that is aspirated, since the non-aspirated version tends to drift a degree or two too high when afternoon wind is light. Thanks!
Dirk | 07/26/2023 at 08:22 PM
Hi Bill,
Sorry I didn't respond sooner! The station I installed is still there and will be for awhile yet.
It's my understanding that they are planning to upgrade the sensor, but I don't know where they are in that process currently.
Best,
Dirk
Please log in or register to comment.